
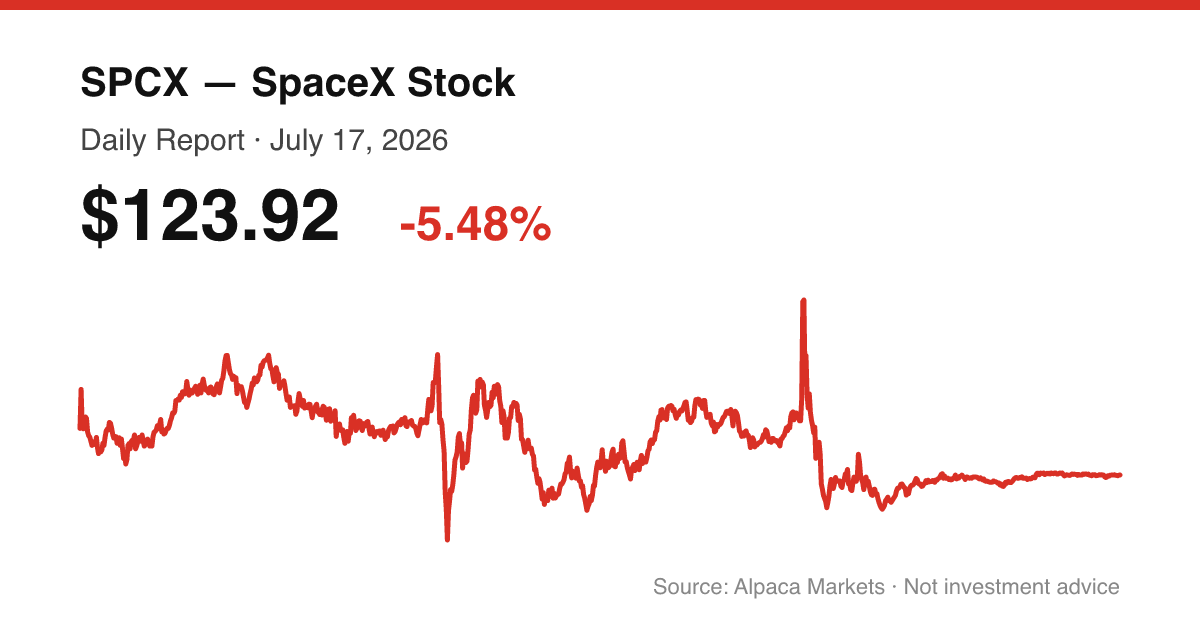
Hover to inspect · pre-market & after-hours shaded · MA(10) and RSI(14) computed from the session
SPCX · NASDAQ · July 17, 2026
Slides Below IPO Price After Starship Abort
SPCX closed at $123.93 on July 17, 2026, down 5.48% versus the prior session's $131.11 close and now trading below its $135 IPO offer price.
Executive Summary
SPCX extended its post-IPO slide on Friday, closing at $123.93 and falling further below the stock's $135 IPO offer price. The session's proximate catalyst was a last-second Starship test abort, with reporting attributing the scrub to two Raptor engines failing to ignite on the Super Heavy booster; the launch was described as rescheduled for early the following week. The decline also came alongside a broader selloff in AI-adjacent and semiconductor names tied to competitive concerns out of China, a backdrop that weighed on high-multiple growth stocks generally. Coverage of the session also flagged rising short-seller interest in SPCX and noted the stock's thin public float, alongside commentary on upcoming lockup expirations as a factor investors are watching.
Sentiment in the day's coverage was mixed: some pieces framed the pullback as a re-rating of an extreme post-IPO valuation, while others argued the Starship delay itself is not consequential to the long-term business and that the selloff reflects float and macro dynamics more than fundamentals. Either way, the price action itself is unambiguous — SPCX closed at a new post-IPO low and below its offer price for a second consecutive session.
News
1. SpaceX vs. Caterpillar: Which Stock Is a Better Buy in 2026, the Aerospace Innovator or the Construction Giant?
The article compares SpaceX and Caterpillar as investment options in 2026. SpaceX shows impressive 33.2% revenue growth but operates at a $4.9 billion net loss with negative $14 billion free cash flow, trading at a 197.7x forward P/E ratio. Caterpillar generates $10.3 billion in annual free cash flow with 13.1% net margins and trades at 34.7x forward P/E. The author recommends Caterpillar as the safer choice due to profitability, dividend payments, and exposure to AI-driven data center construction, while SpaceX represents a speculative bet on long-term space economy growth. (The Motley Fool, Jul 17, 4:25 PM ET)
2. David Sacks, Bill Ackman Sound the Alarm on China's Kimi K3 as Nvidia, Micron Slide
China's Kimi K3 has Sacks and Ackman sounding the alarm and chip stocks slipping. But Polymarket traders still give US labs the edge over Moonshot. (Benzinga, Jul 17, 3:46 PM ET)
3. SpaceX vs. AST SpaceMobile: Which Space Stock Will get Your Portfolio Into Orbit in 2026?
SpaceX and AST SpaceMobile are competing in the satellite communications space with different business models. SpaceX dominates rocket launches and operates Starlink with 10.3 million subscribers but faces massive capital requirements and negative free cash flow of -$14 billion in FY 2025. AST SpaceMobile is building a direct-to-device cellular network with partnerships from major carriers and expects profitability by 2027, though it currently has negative free cash flow of -$1.1 billion. The article recommends AST SpaceMobile as the better 2026 buy due to its more focused business plan and earlier path to profitability. (The Motley Fool, Jul 17, 3:19 PM ET)
4. Watching CoreWeave; Shares See Volume To The Downside After WSJ Reported SpaceX in Talks to Provide Computing Power for Pentagon’s AI Push
(Benzinga, Jul 17, 3:18 PM ET)
5. CORRECTION: 'SpaceX in Talks to Provide Computing Power for Pentagon’s AI Push' - WSJ Exclusive
(Benzinga, Jul 17, 3:15 PM ET)
6. 'SpaceX in Talks to Provide Computing Power for Pentagon’s AI Push' - Bloomberg News
(Benzinga, Jul 17, 3:05 PM ET)
7. SpaceX Continues Slide Below IPO Price After Last-Second Starship Abort: Traders Bet on Liftoff Within Days
SpaceX (SPCX) continues to slide below its $135 IPO price after a last-second Starship launch abort. Here’s what caused the scrub and what prediction markets expect next. (Benzinga, Jul 17, 2:47 PM ET)
8. China's AI Breakthrough Triggers A Semiconductor Selloff—What It Means For Investors
AI Breakthrouh
Please click here for an enlarged chart of Direxion Daily Semiconductor Bull 3X ETF (NYSE:SOXL).
Note the following:
Semiconductors are the leading sector that has been driving the stock (Benzinga, Jul 17, 1:46 PM ET)
Price Action
| Metric | Value |
|---|---|
| Open | $127.63 |
| High | $130.33 |
| Low | $122.12 |
| Close | $123.93 |
| Change vs prior close | -5.48% |
| Volume | 74,654,559 |
| Intraday range | $8.21 |
| Close vs IPO offer price ($135) | -8.20% |
SPCX opened at $127.63, already below Thursday's $131.11 close, and traded in an $8.21 range between $130.33 and $122.12 before settling at $123.93. Volume came in at 74,654,559 shares, above the prior session's 58,813,984 but below the average volume to date of 96,757,629. The close marks a fifth straight decline from the June 16 post-IPO high of $201.80 and is now 8.2% under the $135 IPO offer price and 23.0% under the June 12 IPO-day close of $160.95.
The session extended the stock's post-IPO downtrend, with the close landing below the IPO offer price for a second consecutive day.
Technicals
SPCX has been trading for roughly five weeks since its June 12, 2026 IPO. With this little history, the 14-day RSI and the 20/50/200-day moving averages are not yet reliable — SMA-50 and SMA-200 are not available, and the shorter averages carry limited statistical weight. The read below leans on price structure, candle shape, volume, and the concrete levels present in the data rather than on longer-horizon indicators.
Trend
The daily close history shows a clear structure: a spike from the $160.95 IPO close to a $201.80 high on June 16, followed by a sustained decline to $123.925 on July 17, with only a brief bounce in late June ($153-$170 range) before the slide resumed. The short-term averages confirm the downtrend's shape: SMA-5 ($133.10) sits above EMA-5 ($132.95), both of which sit above the current close, while SMA-10 ($142.12) and SMA-20 ($151.61) sit progressively higher still — a stack consistent with a stock trending down across every timeframe it has traded.
Candle read
The session produced a bearish candle: open $127.63, close $123.925, for a body of -3.70. The upper wick measured 2.70 (high of $130.3299 versus the open/close range) and the lower wick measured 1.80 (low of $122.12 versus the open/close range), for a total range of 8.21. The close location value of 0.22 means the close settled in the lower quarter of the day's range — sellers were in control into the close rather than buyers stepping in to lift price off the lows.
Support levels
- $122.12 — the session low, the most immediate support on the chart.
- $120.00 — the nearest round-number level below the current close.
- $131.11 — the prior close, now acting as the first level to reclaim on any bounce rather than as support.
Resistance levels
- $125.00 — a round-number level just above the close.
- $127.63 — today's open.
- $130.33 — today's high.
- $133.10 / $132.95 — the SMA-5 and EMA-5, both now above price and acting as short-term resistance.
- $135.00 — the IPO offer price, a psychologically significant level the stock is currently trading beneath.
Momentum interpretation
Bull scenario: a reclaim of the $130.33 intraday high on above-average volume would suggest sellers are losing control, with $133.10 (SMA-5) and $135.00 (the IPO offer price) as the next levels to watch on continued strength.
Bear scenario: a break of the $122.12 session low, particularly on rising volume, would open the path toward the $120.00 round number with no other levels in the recent data between the two.
Neutral scenario: continued consolidation between $122.12 and $130.33 without a decisive volume-backed break in either direction would leave the stock rangebound just below the IPO offer price. RSI-14 at 35.89 is approaching oversold territory but has not reached the sub-30 zone that would typically flag an extreme reading, for whatever weight that carries this early in the stock's trading history.
Trading Takeaway
SPCX closed lower for a fifth straight session, finishing at $123.93 and below its $135 IPO offer price for a second day in a row, with a bearish candle that closed in the lower quarter of its range on volume above the prior session but below the trailing average. The short-term moving average stack (SMA-5 through SMA-20) remains stacked above price, consistent with an intact downtrend, though the standard longer-horizon indicators aren't yet available to confirm or contradict that read given the stock's limited trading history.
Next session, the key levels to watch are $122.12 support and $130.33 resistance on the upside, with a break of either likely to set the near-term direction.
Sources
- SpaceX vs. Caterpillar: Which Stock Is a Better Buy in 2026, the Aerospace Innovator or the Construction Giant? — The Motley Fool
- David Sacks, Bill Ackman Sound the Alarm on China's Kimi K3 as Nvidia, Micron Slide — Benzinga
- SpaceX vs. AST SpaceMobile: Which Space Stock Will get Your Portfolio Into Orbit in 2026? — The Motley Fool
- Watching CoreWeave; Shares See Volume To The Downside After WSJ Reported SpaceX in Talks to Provide Computing Power for Pentagon's AI Push — Benzinga
- CORRECTION: 'SpaceX in Talks to Provide Computing Power for Pentagon's AI Push' - WSJ Exclusive — Benzinga
- 'SpaceX in Talks to Provide Computing Power for Pentagon's AI Push' - Bloomberg News — Benzinga
- SpaceX Continues Slide Below IPO Price After Last-Second Starship Abort: Traders Bet on Liftoff Within Days — Benzinga
- China's AI Breakthrough Triggers A Semiconductor Selloff—What It Means For Investors — Benzinga
- SpaceX Stock Drops on Friday. Should Investors Cheer? — The Motley Fool
- QUICK SPARK: SpaceX Stock Attracts Short Sellers on the Way Down — Benzinga
- Dow Holds Steady While Nasdaq Stumbles: What Moved Markets This Week — The Motley Fool
- QUICK SPARK: How Elon Musk Suffered a $500B Wealth Implosion in Just a Month — Benzinga
- Why SpaceX Stock Dropped on Friday — The Motley Fool
- SpaceX's Selloff Has Investors Asking the Wrong Question — Benzinga
- Dan Ives Warns SpaceX's 'Valuation Support is Not There' Yet As Stock Struggles, But Claims Musk's Rocket Firm Will Be Central to the 'Fourth Industrial Revolution' — Benzinga
- SpaceX Delayed Its Starship Launch and the Stock Fell Below Its IPO Price. One of Those Things Matters. The Other Doesn't. — The Motley Fool
- SpaceX Stock is Dipping Today: What's Going On? — Benzinga
- SpaceX Buying Tesla at Current Valuations Would Not 'Pass Muster,' Gary Black Says as SPCX Retreats From Post-IPO Highs — Benzinga
- Elon Musk Is Betting Big on Natural Gas. Here's What It Means for Energy Stocks. — The Motley Fool
- Leaving Blue Origin for SpaceX? Jeff Bezos Reportedly Puts Employees in 'Golden Handcuffs' With New Equity Clause — Benzinga
- San Francisco Mayor Calls for Stricter Robotaxi Rules After Waymo Traffic Chaos: Report — Benzinga
- Tim Draper Shares Three Traits That Separate Billion-Dollar Founders From Everyone Else — Benzinga
- Prediction: 3 Reasons SpaceX Could Fall 50% Over the Next Year — The Motley Fool
- 3 Reasons SpaceX Stock Could Drop 30% by 2028 — The Motley Fool
- ASTS Punished Over 1.5% Dilution? Shay Boloor Bought the Dip, Calls Fundraise 'Completely Misunderstood' — Benzinga
- Elon Musk Says It's 'True' to Prediction That Says Internet Browsers, Websites and Software Are Set to Disappear — Benzinga
- SpaceX, Alphabet, and SK Hynix Are Quietly Flashing a Bullish Signal Investors Should Not Ignore — The Motley Fool
- Alpaca Markets (SIP) — market data
Disclaimer
This report is for informational purposes only and does not constitute investment advice, a recommendation, or an offer to buy or sell any security. Market data and news summaries are provided as of the timestamps noted and may be incomplete or delayed. Readers should verify all figures independently and consult a qualified financial advisor before making investment decisions.