
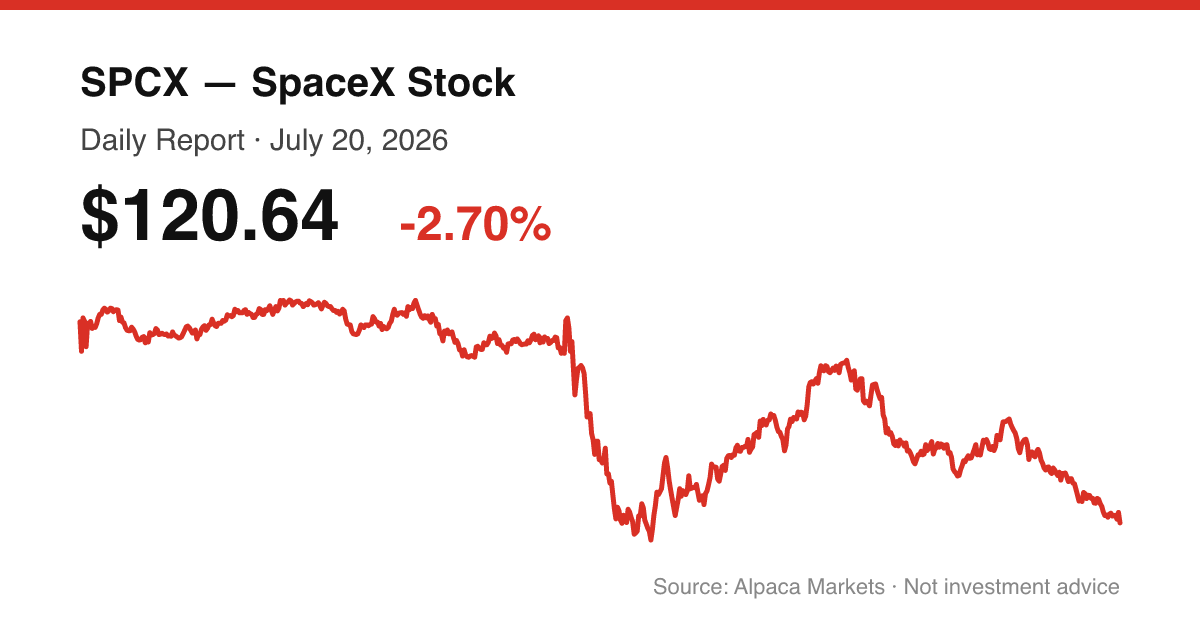
Hover to inspect · pre-market & after-hours shaded · MA(10) and RSI(14) computed from the session
SPCX · NASDAQ · July 20, 2026
SpaceX Slumps as Starship Test Scrub Deepens Selloff
SPCX closed at $120.64, down 2.7% from the prior close of $123.99, after trading as high as $125.70 and as low as $120.10 during the session.
Executive Summary
SPCX fell again on Monday, closing at $120.64 and moving below its $135 IPO offer price for the first time since the June 12 listing. The session extended a multi-week slide that has taken the stock from its June 16 closing high of $201.80 down more than 40%. Coverage attributed the drop to a scrubbed Starship test flight tied to engine ignition failures, with commentary noting Elon Musk's stated intent to attempt another launch within days using replacement engines. Other headlines cited a Benzinga piece quoting Whitney Tilson describing the shares as overvalued even after falling below the IPO price, a Motley Fool note flagging the company's valuation multiple against a lack of current profitability, and a summary describing the past week's decline in aggregate dollar terms.
Separately, a Benzinga item reported that SpaceX, alongside Rocket Lab and others, received a $17 billion U.S. National Security Space Launch Phase 3 Lane 1 contract award, and another noted SpaceX is reportedly in talks to provide Pentagon AI infrastructure, an area currently served by Microsoft, Amazon, and Google. Neither report included a figure isolating SpaceX's specific share of the contract value or additional financial detail beyond what is stated here. The net session result was continued selling pressure despite the contract-related headlines circulating the same day.
News
1. SpaceX Stock Selloff: ‘Don’t Even Think About Bottom-Fishing,’ Expert Says
Former hedge fund manager Whitney Tilson thinks SpaceX shares are overvalued, even after falling below their IPO price. (Benzinga, Jul 20, 2:38 PM ET)
2. Rocket Lab, SpaceX, Others Receive $17B Contract From U.S. National Security Space Launch Phase 3 Lane 1
(Benzinga, Jul 20, 2:13 PM ET)
3. Why Did SpaceX Stock Drop Again on Monday?
SpaceX stock fell below its IPO price after scrubbing a Starship test flight due to engine ignition failures. Despite Elon Musk's promise to retry within days with replacement engines, investors continued selling the stock on Monday. The company trades at 84x trailing revenue with no current profits, leaving analysts questioning the valuation until profitability materializes. (The Motley Fool, Jul 20, 1:33 PM ET)
4. Winners And Losers From Moonshot—Wall Street Fears Overblown—US May Ban Chinese Models
Moonshot Winners And Losers
Please click here for an enlarged chart of Micron Technology Inc (NASDAQ:MU).
Note the following:
This article is about the big picture, not an individual stock. The chart of (Benzinga, Jul 20, 11:59 AM ET)
5. xAI Introduces Grok For Excel, Bringing AI-Powered Analysis And Automation Directly Into Spreadsheets
(Benzinga, Jul 20, 11:51 AM ET)
6. CoreWeave Q2 Preview: Expect 108% Revenue Growth, Margin May Disappoint
CoreWeave expects strong Q2 revenue growth. BofA maintains a Buy rating and $140 PT. Expects margin to miss the consensus estimate. (Benzinga, Jul 20, 11:31 AM ET)
7. QUICK SPARK: SpaceX's Brutal Week Erased More Stock Value Than Boeing's Entire Market Cap
SpaceX's stock value dropped $283 billion last week, more than the entire market cap of Boeing. (Benzinga, Jul 20, 10:17 AM ET)
8. Why Intel Stock Soared 278% In the First Half of 2026
Intel's stock surged 278% in the first half of 2026 following better-than-expected Q1 results, strong data center revenue growth, and new partnerships with Apple, Tesla, and SpaceX. However, shares have fallen 28% since June as investors question the stock's expensive valuation with a P/E ratio of 904 compared to the tech sector average of 34. (The Motley Fool, Jul 20, 10:10 AM ET)
Price Action
| Metric | Value |
|---|---|
| Open | $125.22 |
| High | $125.70 |
| Low | $120.10 |
| Close | $120.64 |
| Change vs prior close | -2.70% ($123.99 to $120.64) |
| Volume | 42,675,710 |
| Intraday range | $5.60 |
| Close vs IPO | -10.6% vs IPO offer price ($135.00) |
SPCX opened at $125.22, pushed modestly higher to $125.70 early, then sold off through the session to a low of $120.10 before closing at $120.64, just above that low. The close sits below both the prior day's close of $123.99 and the $135.00 IPO offer price, putting the stock roughly 25% below its June 12 IPO close of $160.95. Volume of 42,675,710 shares came in below the average volume to date of 85,731,336 and below the prior session's volume of 83,807,840.
The close below the IPO offer price is the session's key technical development.
Technicals
SPCX has traded for roughly five weeks since its June 12 IPO. With that little history, the 14-day RSI and the 20/50/200-day moving averages are not yet statistically meaningful in the way they would be for a seasoned stock (SMA-50 and SMA-200 are not available at all). The reads below lean on price structure, candle shape, volume, and the real levels present in the data rather than on longer-window indicators.
Trend
Closing prices since the IPO show a clear round trip: from the June 12 IPO close of $160.95, the stock rallied to a peak close of $201.80 on June 16, then reversed into a decline through late June, briefly bounced to $170.86 on June 30, and has since fallen in a series of lower closes through July, reaching $120.64 today. The move from $123.99 (July 17 close) to today's $120.64 continues that same downward path, with no closing print above the prior day's close since July 9.
Candle read
Today's candle has a body of -4.58 within a total range of 5.60, an upper wick of 0.48, and a lower wick of 0.54. The close-location value of 0.1 means the close settled very near the low of the session's range. Combined with the large body relative to the small wicks on both ends, this reads as a session where sellers were in control from the open through the close, with limited buying interest emerging late in the day.
Support levels
The session low of $120.10 is the nearest support, reinforced by proximity to the $120.00 round number. Below that, the data does not contain a traded level; the next reference point would be further round-number territory such as $115.00, untested today. The $135.00 IPO offer price, now broken, sits well above current price and no longer functions as support.
Resistance levels
The prior close of $123.99 is the first overhead level to reclaim. Above that, today's own high of $125.70 marks a second hurdle. Further up, the short-term moving averages all sit above the current price and would act as resistance on any bounce: SMA-5 at $129.42, EMA-5 at $128.86, and SMA-10 at $138.15. The $135.00 IPO offer price, now below the stock, has flipped from a support reference to a resistance level. SMA-20 at $148.40 and the June 12 IPO close of $160.95 mark more distant resistance.
Momentum interpretation
Bull scenario: a reclaim of the prior close at $123.99, followed by a push back above the SMA-5 at $129.42, would be the first sign of stabilization. A sustained move back above the $135.00 IPO offer price would mark a more decisive reversal of the current trend.
Bear scenario: a break below today's low of $120.10 and the $120.00 round number would open the door to further downside with no intervening traded support level in the data. RSI-14 at 34.65 is not yet at the conventional 30 oversold threshold, leaving room for further decline before that condition is met.
Neutral scenario: continued consolidation between the session low of $120.10 and the prior close of $123.99, without a decisive break in either direction, while RSI-14 holds in the mid-30s.
Trading Takeaway
SPCX closed below its $135.00 IPO offer price for the first time, extending a decline that has taken the stock down from its June 16 peak close of $201.80. The session's candle shape, closing near its low with a large red body, points to continued seller control. Volume came in below both the prior session and the average volume to date, indicating the move down was not accompanied by a volume surge. For the next session, the key levels to watch are the $120.10 session low and the $120.00 round number on the downside, and the $123.99 prior close followed by the $125.70 session high on the upside.
Sources
- SpaceX Stock Selloff: 'Don't Even Think About Bottom-Fishing,' Expert Says — Benzinga
- Rocket Lab, SpaceX, Others Receive $17B Contract From U.S. National Security Space Launch Phase 3 Lane 1 — Benzinga
- Why Did SpaceX Stock Drop Again on Monday? — The Motley Fool
- Winners And Losers From Moonshot—Wall Street Fears Overblown—US May Ban Chinese Models — Benzinga
- xAI Introduces Grok For Excel, Bringing AI-Powered Analysis And Automation Directly Into Spreadsheets — Benzinga
- CoreWeave Q2 Preview: Expect 108% Revenue Growth, Margin May Disappoint — Benzinga
- QUICK SPARK: SpaceX's Brutal Week Erased More Stock Value Than Boeing's Entire Market Cap — Benzinga
- Why Intel Stock Soared 278% In the First Half of 2026 — The Motley Fool
- SpaceX Wants To Power Pentagon AI. Microsoft, Amazon And Google Already Do. — Benzinga
- SpaceX vs. Archer Aviation: Which Aerospace Stock Is a High Flyer for 2026? — The Motley Fool
- What Happens to Stocks After Joining the Nasdaq-100 (History Has a Clear Answer) — The Motley Fool
- Alpaca Markets (SIP) — market data
Disclaimer
This report is for informational purposes only and does not constitute investment advice, a recommendation, or an offer to buy or sell any security. SPCX has a limited trading history, and figures presented here may not reflect subsequent corrections or restatements. Readers should verify all data independently and consult a qualified financial advisor before making investment decisions.