
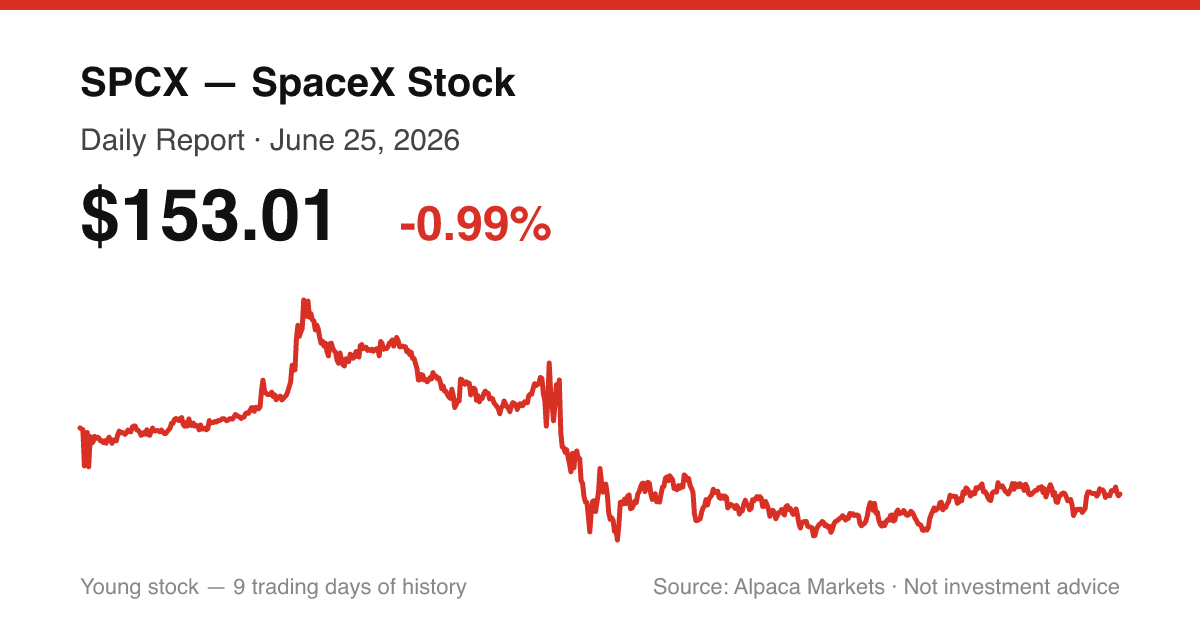
Hover to inspect · pre-market & after-hours shaded · MA(10) and RSI(14) computed from the session
SPCX · NASDAQ · June 25, 2026
SpaceX Launches AI Compute Satellite Plan With Gigasat Facility
SPCX closed at $153.01 on June 25, 2026, down $1.53 (-0.99%) from the prior session, setting a new post-IPO closing low as the stock extended its pullback from the June 16 peak for a fourth consecutive session.
Executive Summary
SPCX logged a quiet session by volume — 52.5 million shares changed hands, roughly 23% of its average daily turnover since the June 12 IPO — but the price action told a clear story. An early push to $160.65 was cleanly rejected at the 5-day simple moving average, the stock drifted lower to touch $150.00, and a partial recovery left the close in the lower quarter of the day's range. The three-session consolidation shelf at $154 to $156 that had formed over June 22 through 24 failed to hold, and $153.01 is now the lowest closing price since the IPO.
The macro backdrop added pressure. Allianz CIO Ludovic Subran publicly characterized SpaceX's $25 billion bond deal — arranged weeks after the company's $86 billion IPO — as a sign that markets have tipped into bubble territory, and multiple analysts published pieces questioning the stock's price-to-sales valuation relative to comparable large-cap growth names. Credit derivatives on SpaceX debt began trading following the debut bond sale. Partially offsetting the negative tone, Triller Group announced a $411 million acquisition of SpaceX shares to hold as a strategic treasury asset, and SpaceX disclosed plans to begin construction of a natural gas pipeline to its Texas launch facilities in July while detailing ambitions to deploy millions of AI compute satellites from a massive manufacturing facility in Texas it is calling Gigasat.
News
1. The SpaceX Version Of MSTR Has Arrived—And Its Stock Soared 393%
Triller Group (ILLR) stock surges nearly 400% after announcing a $411M SpaceX treasury play. Here is the math behind the high-leverage MicroStrategy-style move. (Benzinga, Jun 25, 4:14 PM ET)
2. SpaceX To Begin Construction Of Natural Gas Pipeline To Texas Launch Facilities In July
(Benzinga, Jun 25, 2:46 PM ET)
3. Why Is Redwire Stock Falling On Thursday?
Redwire (RDW) stock falls 8% on $500M ATM dilution fears and cooling space sector sentiment. Get the latest technical levels. (Benzinga, Jun 25, 2:01 PM ET)
4. 8 Communication Services Stocks With Whale Alerts In Today’s Session
This whale alert can help traders discover the next big trading opportunities. Whales are entities with large sums of money and we track their transactions here at Benzinga on our options activity scanner. Traders will (Benzinga, Jun 25, 1:35 PM ET)
5. SpaceX Bond Deal Signals Market 'Bubble,' Allianz Exec Warns: Elon Musk Got '$70 Billion Of Funny Money'
Allianz CIO Ludovic Subran says SpaceX's $25 billion bond deal weeks after its $86 billion IPO shows markets have tipped into bubble territory. (Benzinga, Jun 25, 12:54 PM ET)
6. 'SpaceX Credit Derivatives Start to Trade After Debut Bond Sale' - Bloomberg News
(Benzinga, Jun 25, 12:18 PM ET)
7. SpaceX Wants to Deploy Millions of AI Compute Satellites in Space. Here's How It Plans to Get There.
SpaceX plans to deploy millions of AI compute satellites into orbit, aiming for 1 gigawatt of capacity by end of 2027, scaling to 1 terawatt by 2030. The company is building a massive 11-million-square-foot manufacturing facility in Texas called 'Gigasat' for satellite production. While investors are enthusiastic about the ambitious plan, the article cautions that challenges ahead could test investor patience, and recommends monitoring progress before buying. (The Motley Fool, Jun 25, 11:34 AM ET)
8. Space Stocks In June Gloom: Rocket Lab, Redwire, Firefly Fade While SpaceX Steals The Show
Space stocks give back 2026 gains as SpaceX steals the spotlight with a blockbuster initial public offering. (Benzinga, Jun 25, 11:26 AM ET)
Price Action
| Metric | Value |
|---|---|
| Open | $156.65 |
| High | $160.65 |
| Low | $150.00 |
| Close | $153.01 |
| Change vs prior close | -$1.53 / -0.99% |
| Volume | 52,493,016 |
| Avg daily volume (since IPO) | 225,603,177 |
| Intraday range | $10.65 |
| Close vs IPO offer price ($135.00) | +$18.01 / +13.34% |
| Close vs IPO first-day close ($160.95) | -$7.94 / -4.93% |
SPCX opened at $156.65 and immediately rallied to $160.65 in early trading, a level that coincided precisely with the SMA-5 of $160.65. Sellers absorbed that test completely and the stock reversed, falling over ten points from high to low before finding intraday support at $150.00. A partial recovery lifted the close to $153.01, but the stock still finished in the lower 28% of the day's range, indicating bears retained control through the close.
Volume of 52.5 million shares was the lightest session since the IPO by a significant margin against a post-IPO daily average of 225.6 million. The low turnover on a down day cuts both ways: it suggests the seller base is thinning, but thin conditions can also allow a stock to drift lower without generating the kind of volume that historically marks a capitulation low. Today's tape does not provide a clean read.
From the June 16 closing high of $201.80 in the price history, the total drawdown to today's close is 24.2%. SPCX still trades 13.34% above the $135.00 IPO offer price and 4.93% below the $160.95 IPO first-day close. The lowest close since the IPO is now on the board.
The defining fact of the session: the intraday high and the SMA-5 are the same number, $160.65. The stock tested its 5-day moving average at the high and was turned away immediately.
Technicals
SPCX has completed nine trading sessions as of June 25, 2026. Indicators requiring 10, 14, 20, 50, or 200 bars of daily history — SMA-10, SMA-20, RSI-14, SMA-50, and SMA-200 — are not yet computable and are excluded. The read below is based on price structure, candle anatomy, volume context, and the two available short-term averages.
Trend
The structure is a consistent decline from the June 16 closing high of $201.80. The stock has closed below both the SMA-5 ($160.65) and EMA-5 ($160.56) for each of the last four sessions and is setting new post-IPO closing lows. No base has formed, no reversal signal is in place, and today's rejection at the 5-day moving average reinforces rather than interrupts the downtrend.
Candle read
The day produced a bearish candle with a $4.00 upper wick (open $156.65 to high $160.65), a $3.64 bearish body (open $156.65 to close $153.01), and a $3.01 lower wick (close $153.01 to low $150.00). The close location of 0.28 places the close in the lower 28% of the $10.65 daily range.
The shape narrates the session precisely: early buyers pushed to the SMA-5 and were immediately overwhelmed, sellers drove the stock to $150.00 where demand absorbed the decline temporarily, and the close near session lows shows bears held the advantage into the bell. The lower wick acknowledges a real intraday floor at $150, but a close location of 0.28 is not a reversal signal. This is a bearish candle with no meaningful bottom indication.
Support levels
$150.00 — tested intraday and held; the first concrete price floor established below the former $154 to $156 shelf. It is the only support reference in today's session and the only level below current price with any observed demand response.
$135.00 — the IPO offer price; a well-publicized round number that represents the institutional placement cost basis. Not tested, but carries psychological weight as the furthest structural anchor below current price in this dataset.
Resistance levels
$154.54 to $154.60 — the consolidation shelf from the June 22 and June 24 closes; former support is now the nearest overhead resistance. Reclaiming this zone on a closing basis would be the first constructive signal.
$156.11 — the June 23 close, the top edge of the broken shelf.
$160.56 to $160.65 — the EMA-5 and SMA-5, which converged with today's intraday high. The clean and immediate rejection at this level gives it technical definition as resistance.
$160.95 — the IPO first-day closing price; a structural reference that marked the starting point of the post-IPO rally and carries significance as a prior floor that has now become ceiling.
Momentum interpretation
Bull scenario (levels to watch): the stock reclaims $154.54 on a closing basis and sustains above that level for a session or more. Follow-through above $156.11 would suggest the three-week pullback from the June 16 high is forming a base. Volume above today's 52.5 million, ideally with a constructive candle, would add credence.
Bear scenario (levels to watch): a closing break below $150.00 removes the only tested intraday floor in the dataset below current price. The next reference level in the price history is the IPO offer price at $135.00, roughly 12% lower.
Neutral scenario (levels to watch): low-volume oscillation between $150 and the $154 to $156 shelf without conviction in either direction. Given today's thin volume, this is a plausible near-term path — the seller base may be exhausted without buyers yet willing to step in aggressively.
Trading Takeaway
SPCX closed at a new post-IPO low of $153.01, breaking a three-session consolidation shelf that had held at $154 to $156. The session's defining technical event was the precise rejection at the SMA-5 ($160.65) on the intraday high — the stock tested its 5-day moving average, found no follow-through, and sold off. The rebound off $150.00 was real but modest, and the close location confirms bears controlled the session.
For the next session, the two levels that matter most are $150.00 on the downside and the $154.54 to $156.11 zone on the upside. A close below $150 would extend the post-IPO drawdown beyond the only observed intraday support, with no close-price history below that level. A close back above $154.54 would be the first signal that the breakdown is failing. Volume remains the key variable — a directional move on thin volume is harder to trust in either direction.
Sources
- https://www.benzinga.com/markets/prediction-markets/26/06/60115503/the-spacex-version-of-mstr-has-arrived-and-its-stock-soared-393
- https://www.benzinga.com/quote/UNG
- https://www.benzinga.com/trading-ideas/movers/26/06/60110753/why-is-redwire-stock-falling-on-thursday
- https://www.benzinga.com/markets/options/26/06/60109756/8-communication-services-stocks-whale-alerts-today-s-session
- https://www.benzinga.com/markets/prediction-markets/26/06/60107963/spacex-bond-deal-signals-market-bubble-allianz-exec-warns-elon-musk-got-70-billion-of-funny-money
- https://www.benzinga.com/news/26/06/60106315/spacex-credit-derivatives-start-trade-after-debut-bond-sale-bloomberg-news
- https://www.fool.com/investing/2026/06/25/spacex-deploy-millions-ai-compute-satellites/?source=iedfolrf0000001
- https://www.benzinga.com/trading-ideas/movers/26/06/60103934/space-stocks-in-june-gloom-rocket-lab-redwire-firefly-fade-while-spacex-steals-the-show
- https://www.fool.com/investing/2026/06/25/elon-musk-just-lost-his-trillionaire-status-as-spacex-and-tesla-stocks-plummet-should-investors-buy-the-dip/?source=iedfolrf0000001
- https://www.fool.com/investing/2026/06/25/this-massive-space-stock-boom-could-have-a-hidden/?source=iedfolrf0000001
- https://www.fool.com/investing/2026/06/25/already-own-tesla-stock-add-spacex-portfolio/?source=iedfolrf0000001
- https://www.fool.com/investing/2026/06/25/spacex-spcx-stock-is-plunging-should-you-buy-the-d/?source=iedfolrf0000001
- https://www.benzinga.com/m/26/06/60095217/triller-group-subsidiary-acquire-3-917m-spacex-shares-through-sac1-411-304m
- https://www.benzinga.com/news/26/06/60094925/triller-group-acquire-undisclosed-significant-position-spacex-be-held-strategic-treasury-asset
- https://www.fool.com/investing/2026/06/25/spacex-spcx-is-down-31-from-its-high-and-is-now-bo/?source=iedfolrf0000001
- https://www.fool.com/investing/2026/06/25/should-you-really-buy-tech-stocks-now-history-offe/?source=iedfolrf0000001
- https://www.benzinga.com/markets/tech/26/06/60093229/tesla-bulls-push-wild-robotaxi-theory-but-gary-black-says-the-spacex-merger-talk-makes-no-sense-at-all
- https://www.benzinga.com/markets/equities/26/06/60092975/could-spacex-be-the-latest-fomo-trap-asset-manager-warns-many-buyers-dont-fully-understand-what-they-own-its-when-your-family
- https://www.fool.com/investing/2026/06/25/is-spacex-a-better-buy-than-amazon/?source=iedfolrf0000001
- https://www.fool.com/investing/2026/06/25/spacex-stock-down-23-ipo-this-happen-next-big-move/?source=iedfolrf0000001
- https://www.benzinga.com/markets/tech/26/06/60089098/jeff-bezos-challenges-elon-musk-biggest-bets-tesla-spacex
- https://www.benzinga.com/markets/tech/26/06/60088782/gary-black-says-tesla-continues-to-underperform-the-nasdaq-100-despite-falling-yields-and-oil-prices
- https://www.fool.com/investing/2026/06/25/1-etf-with-31-allocation-to-spacex-spcx-ronb/?source=iedfolrf0000001
- Alpaca Markets (SIP) — market data
Disclaimer
This report is for informational purposes only and does not constitute investment advice, a recommendation to buy or sell any security, or a solicitation of any offer. All market data is sourced from Alpaca Markets (SIP feed) and news sources as cited above. Figures should be independently verified before making any financial decision. Past price behavior is not indicative of future results.