
Hover to inspect · pre-market & after-hours shaded · MA(10) and RSI(14) computed from the session
SPCX · NASDAQ · July 31, 2026
Musk Calls Starlink V3 a Gamechanger After Reaching Space
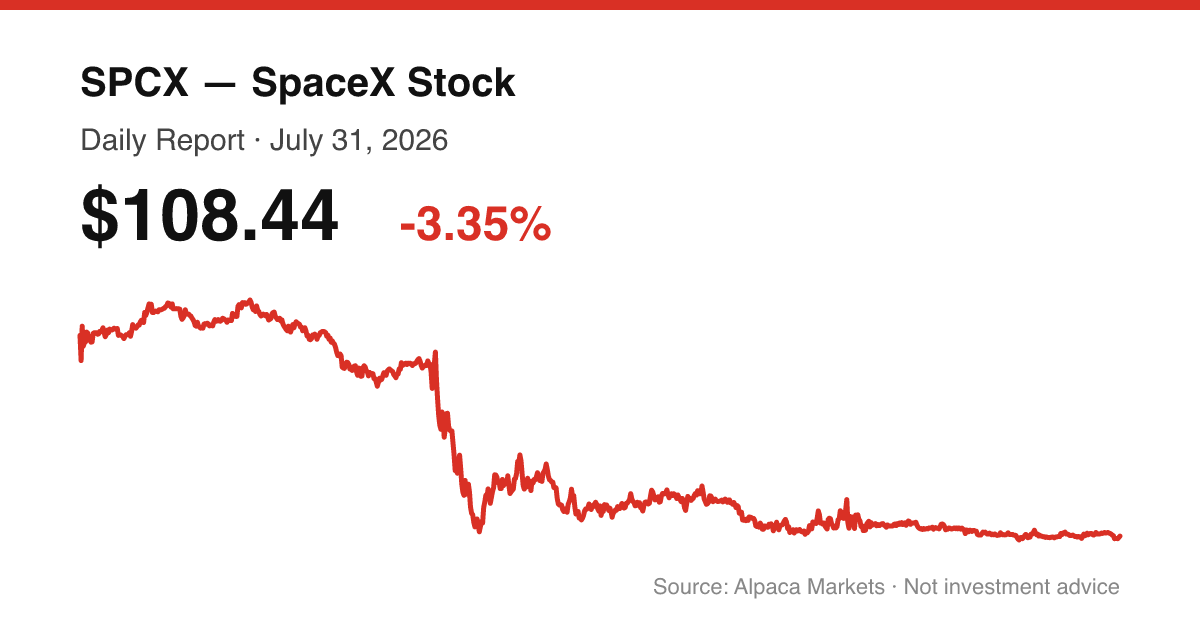
SPCX closed at $108.44 on July 31, 2026, down 3.35% from the prior close of $112.20, on volume of 47,975,207 shares.
Executive Summary
SPCX extended its post-IPO decline on July 31, closing at $108.44 and marking a new closing-period low since the stock's June 12 debut at $160.95. The session's drop of 3.35% came alongside below-average volume of roughly 48 million shares against a 70.67 million trailing average-to-date, suggesting the move was driven more by a lack of buying interest than by a heavy distribution event. The day's news flow was largely tangential to SPCX's own operating results: coverage centered on Elon Musk's net worth relative to Larry Ellison, a Motley Fool piece arguing investors should wait well into 2027 before buying SPCX given a post-IPO underperformance pattern and a price-to-sales ratio the article puts at 76, short-seller Jim Chanos naming SPCX alongside Tesla in a comparison to 1999-era market conditions, and a denied report of a potential Tesla-SpaceX merger tied to a Tesla China divestiture. Separately, Musk highlighted a Starlink V3 satellite milestone and pushed back on short-seller skepticism, calling survival odds for those betting against the stock low.
The technical picture continues to deteriorate. Price closed near the bottom of its intraday range for a second consecutive session and remains well below its short-term moving averages, with the 5-, 10-, and 20-day averages all sitting above the current close and sloping downward.
News
1. Larry Ellison Was Once the World’s Richest Person — Now Elon Musk Is Four Times Wealthier
Larry Ellison briefly passed Elon Musk in 2025 as the world's richest man. Ten months later things are significantly different. (Benzinga, Jul 31, 3:44 PM ET)
2. Forget SpaceX's Upcoming Q2 Results. History Says You Should Wait at Least This Long Before Buying SpaceX Stock.
Historical data suggests investors should wait until mid-2027 or later before buying SpaceX stock, despite the company's recent IPO and operational achievements. Large IPOs typically underperform their market index by 4% over three years, and SpaceX's high P/S ratio of 76 (versus tech sector average of 9) indicates overvaluation. Additionally, accelerating capital expenditures in AI investments raise concerns about future returns. (The Motley Fool, Jul 31, 3:19 PM ET)
3. Wonder Boy Blowup Sparks Massive Semiconductor Rally; Kospi Up 18%; Amazon Helps, Apple Disappoints
Semiconductor Rally
Please click here for an enlarged chart of Direxion Daily Semiconductor Bull 3X ETF (NYSE:SOXL).
Note the following:
Semiconductors are the leading sector that drove the stock market (Benzinga, Jul 31, 2:12 PM ET)
4. Elon Musk Says SpaceX Short-Sellers Have a "Very Low" Survival Probability. Is He Right?
Elon Musk warned that short-sellers betting against SpaceX have low survival probability, but the article notes that statistically, newly IPO'd stocks often decline in the first six months. While Musk's warning may be self-serving, SpaceX's real business fundamentals and Musk's qualification of 'over time' suggest short-sellers face significant long-term risks despite near-term statistical headwinds. (The Motley Fool, Jul 31, 12:14 PM ET)
5. Michael Saylor Says SpaceX, Google and Meta's AI Spending Is a 'Headwind' for Bitcoin
Michael Saylor says AI spending by SpaceX, Google and Meta is competing with Bitcoin for investor capital, creating a temporary headwind for crypto. (Benzinga, Jul 31, 10:37 AM ET)
6. Enron Short Seller Jim Chanos Sees a '1999-Type Moment' in AI Boom, Includes SPCX, TSLA in His Shorts
Jim Chanos made his name calling Enron before it collapsed.
Now the veteran short seller says we’re “closer to a ’99-type moment than a ’97,” meaning the year before the dot-com crash, not the one where the party (Benzinga, Jul 31, 10:35 AM ET)
7. Reported Earlier, 'Tesla Weighs Sale of China Business to Pave Way for Potential SpaceX Merger' - Wall Street Journal
(Benzinga, Jul 31, 9:48 AM ET)
8. Jim Cramer Says ‘Never Count This Man Out’ as Elon Musk Calls Starlink V3 a ‘Gamechanger’ After SpaceX’s Next-Generation Satellites Reach Space
Jim Cramer praises Elon Musk and SpaceX for successful Starlink V3 satellite demonstration, highlighting Musk's track record. (Benzinga, Jul 31, 7:12 AM ET)
Price Action
| Metric | Value |
|---|---|
| Open | $113.03 |
| High | $113.64 |
| Low | $107.57 |
| Close | $108.44 |
| Change vs prior close | -3.35% ($112.20 to $108.44) |
| Volume | 47,975,207 |
| Intraday range | $6.06 |
| Close vs IPO offer price ($135.00) | -19.67% |
SPCX opened at $113.03, essentially in line with the prior close, then spent the session grinding lower, printing a high of $113.635 early on before sliding to a low of $107.5701 and closing at $108.44 — just above the session low. The $6.06 intraday range was the widest in recent sessions relative to the stock's trading levels, and the close sat only 14% of the way up from the low to the high (close location 0.14), indicating sellers were in control into the close. Volume of 47,975,207 shares came in below both the prior session's 56,075,340 and the 70,666,804 average traded to date, so the decline occurred on lighter-than-typical participation. Measured against the $135.00 IPO offer price, SPCX closed the session down 19.67%; measured against the $160.95 first-day close, it is down 32.62%.
The stock closed near its session low on below-average volume, a combination that reflects steady selling pressure rather than a single high-volume capitulation event.
Technicals
SPCX has been public since June 12, 2026, so the standard 14-day RSI and 20/50/200-day moving averages either rest on a very short lookback or, in the case of the 50- and 200-day averages, are not yet computable at all. The readings below should be treated as early and provisional, not as signals with the reliability they'd carry on a name with years of trading history.
Trend
The 5-day SMA ($112.62), 5-day EMA ($112.44), 10-day SMA ($115.51), and 20-day SMA ($128.82) are all stacked above the $108.44 close, and each successively longer average sits higher than the last — a textbook downtrend structure for the short history available. The stock has not closed above its 5-day SMA in this stretch, and the 20-day SMA at $128.82 underscores how far price has fallen from its early post-IPO levels.
Candle read
The July 31 candle had a body of -4.59 (open $113.03 to close $108.44), a small upper wick of 0.61, and a larger lower wick of 0.87, on a total range of 6.06. The close-location value of 0.14 means the close sat just above the low of the day. This is a bearish candle: price opened, drifted down through the session, tested the low late, and could not recover meaningfully off it.
Support levels
- $107.57 — today's intraday low and the most recent closing-period low
- $105.00 — nearest round-number level below the current session low
Resistance levels
- $112.20 to $112.62 — prior close and the 5-day SMA/EMA cluster ($112.20, $112.62, $112.44)
- $113.03 to $113.64 — today's open and intraday high
- $115.51 — 10-day SMA
Momentum interpretation
Bull scenario: a reclaim of the $112.20–$113.64 zone (prior close through today's high) would put price back above the 5-day SMA and EMA and would be the first sign of the recent slide stalling.
Bear scenario: a break below today's $107.57 low opens the way toward the $105.00 round-number level, with no other real levels from this data set in between.
Neutral scenario: continued consolidation between $107.57 and $112.20 without a decisive break of either boundary, with RSI-14 at 32.59 — approaching but not yet in traditional oversold territory (below 30) — suggesting the decline has not reached an extreme reading by that measure.
Trading Takeaway
SPCX closed at a new post-IPO low on below-average volume, closing near the session low for a second straight day while trading beneath all available short-term moving averages. The path of least resistance based on price structure remains lower unless the stock reclaims the $112.20–$113.64 prior-close/high zone. For the next session, the key levels to watch are support at $107.57 (today's low) and $105.00 (round number) on the downside, and resistance at $112.20–$112.62 (prior close/SMA-5/EMA-5 cluster) and $115.51 (10-day SMA) on the upside.
Sources
- Larry Ellison Was Once the World's Richest Person — Now Elon Musk Is Four Times Wealthier — Benzinga
- Forget SpaceX's Upcoming Q2 Results. History Says You Should Wait at Least This Long Before Buying SpaceX Stock. — The Motley Fool
- Wonder Boy Blowup Sparks Massive Semiconductor Rally; Kospi Up 18%; Amazon Helps, Apple Disappoints — Benzinga
- Elon Musk Says SpaceX Short-Sellers Have a "Very Low" Survival Probability. Is He Right? — The Motley Fool
- Michael Saylor Says SpaceX, Google and Meta's AI Spending Is a 'Headwind' for Bitcoin — Benzinga
- Enron Short Seller Jim Chanos Sees a '1999-Type Moment' in AI Boom, Includes SPCX, TSLA in His Shorts — Benzinga
- Reported Earlier, 'Tesla Weighs Sale of China Business to Pave Way for Potential SpaceX Merger' - Wall Street Journal — Benzinga
- Jim Cramer Says 'Never Count This Man Out' as Elon Musk Calls Starlink V3 a 'Gamechanger' After SpaceX's Next-Generation Satellites Reach Space — Benzinga
- Elon Musk Dismisses Report Tesla Could Sell Chinese Business for SpaceX Merger: 'Absurdly Fake News' — Benzinga
- Elon Musk Won't 'Forget' About Mars—But Will SpaceX Land There Before 2030? Prediction Market Bets Reveal This — Benzinga
- Alpaca Markets (SIP) — market data
Disclaimer
This report is for informational purposes only and does not constitute investment advice, a recommendation, or a solicitation to buy or sell any security. Market data and technical readings are based on available data as of the report date and may be incomplete or delayed. SPCX has a limited trading history, and standard technical indicators may not be fully reliable given the short data window. Verify all figures independently before making any financial decision.