
Hover to inspect · pre-market & after-hours shaded · MA(10) and RSI(14) computed from the session
SPCX · NASDAQ · July 2, 2026
Slips Ahead of July 7 Nasdaq-100 Inclusion
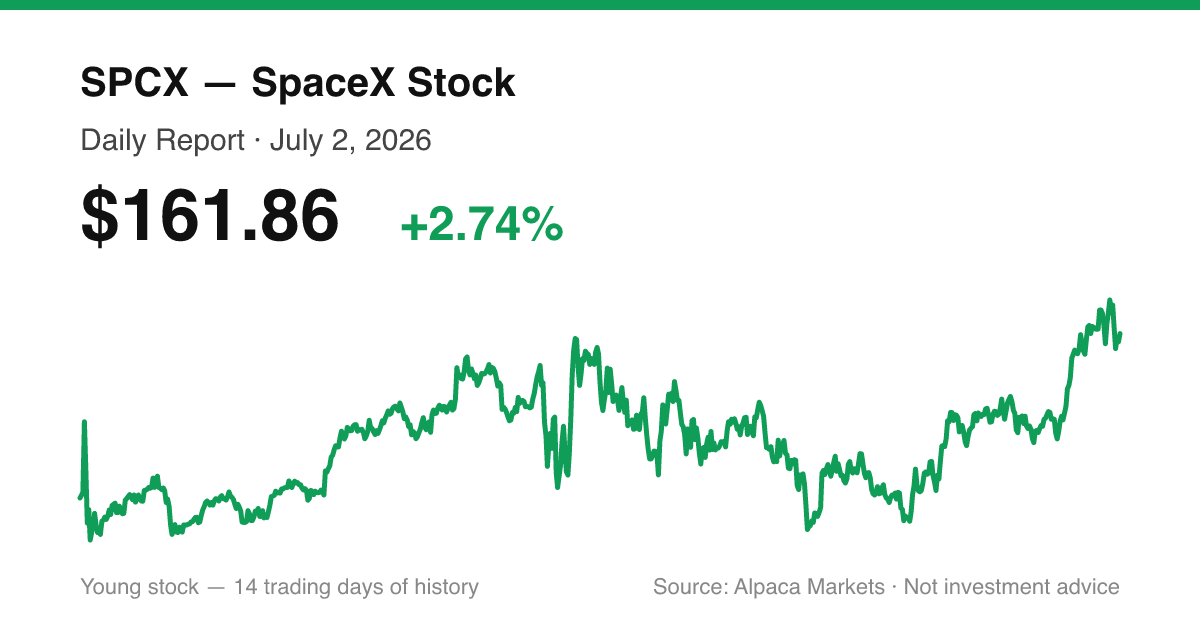
SPCX closed at $161.86 on July 2, 2026, up 2.74% from the prior session's close of $157.54.
Executive Summary
SPCX rebounded on Thursday, closing at $161.86 after opening at $159.725 and trading in a $155.88 to $162.16 range, recovering roughly two-thirds of Wednesday's pullback with a session that finished near its intraday high. The move came alongside a wave of sell-side and financial-media commentary: Daiwa Capital initiated coverage on the stock with a Neutral rating and a $175 price target, while several Motley Fool pieces debated the stock's roughly 110x trailing-sales valuation against its growth in Starlink and AI infrastructure. Coverage also flagged SpaceX's scheduled addition to the Nasdaq-100 index on July 7, which will pull in passive buying from funds tracking the index, including the Invesco QQQ Trust.
Other headlines circulating the same day included the FCC's move to speed satellite license reviews ahead of a July 22 vote, Elon Musk publicly denying reports of a SpaceX AI handheld device, and commentary noting that AST SpaceMobile shares fell 21.6% in June partly on intensifying competition from Starlink. None of these items carry a verified price or volume figure beyond what is captured in the data below, and they are presented here only as the reported backdrop to the session, not as inputs to the technical read that follows.
News
1. SpaceX, Amazon, and the Race to Own the Consumer's Digital Life. Which Stock Wins?
Amazon and SpaceX are competing to become central to consumers' digital lives through different strategies. Amazon leverages its existing dominance in e-commerce, cloud computing (AWS), advertising, and smart-home devices, generating $716.9 billion in revenue. SpaceX is expanding Starlink's satellite broadband and direct-to-cell services to offer connectivity. While SpaceX presents a disruptive opportunity, Amazon appears the stronger risk-adjusted choice due to its established consumer relationships and profitability, despite facing elevated AI infrastructure spending and regulatory pressures. (The Motley Fool, Jul 2, 2:11 PM ET)
2. Why AST SpaceMobile Stock Fell 21.6% In June
AST SpaceMobile's stock declined 21.6% in June due to delayed commercial launch until 2027 following a Blue Origin setback, combined with intensifying competition from SpaceX's Starlink. While AST SpaceMobile pioneered direct-to-device satellite internet, SpaceX's established subscriber base, messaging services, and recent IPO funding give it significant competitive advantages. With AST SpaceMobile generating near-zero revenue while burning over $1 billion annually and trading at a $32.5 billion market cap, investors are questioning the company's ability to compete against SpaceX's superior launch capabilities. (The Motley Fool, Jul 2, 1:29 PM ET)
3. SpaceX Stock: Buy, Sell, or Hold?
SpaceX has gone public but analysts recommend avoiding the stock for new investors due to its extremely high valuation (P/S ratio of 111 vs. tech average of 9), massive capital expenditures ($20.7B in 2025, on pace to exceed this in 2026), and lack of profitability. The company is heavily investing in AI data centers with uncertain near-term returns. Current shareholders should hold rather than sell due to volatility, but prospective investors should wait to see if the company can manage its spending and losses. (The Motley Fool, Jul 2, 1:15 PM ET)
4. A $200 Billion IPO Wave Could Wipe Out $1 Trillion in Stock Market Value. What Investors Need to Know.
The 2026 IPO market is experiencing unprecedented activity with $112.5 billion raised so far and $260+ billion expected by year-end. Mega-IPOs from SpaceX ($85.7B raised), OpenAI ($1T valuation), and Anthropic ($965B valuation) could create significant market pressure. Using a 5x multiplier effect, a $200B IPO wave could risk $1 trillion in market value if investors fund new allocations by selling existing stocks. However, $1.5 trillion in expected buybacks and a larger overall market may help absorb the impact. (The Motley Fool, Jul 2, 12:35 PM ET)
5. SpaceX Stock Edges Higher Before Joining Nasdaq-100 Index on July 7
Space Exploration Technologies shares are trading marginally higher Thursday, in-line with the broader Industrials sector's 0.7% gain. (Benzinga, Jul 2, 10:51 AM ET)
6. EXCLUSIVE: Top 12 Most-Searched Tickers in June on Benzinga Pro — SpaceX, Marvell Join List, Micron Stays On Top
A look at the most searched tickers on Benzinga Pro for the month of June 2026, with new IPO SpaceX making the list in its first month. (Benzinga, Jul 2, 10:38 AM ET)
7. Americans Are Cutting Back on Spending. Here's Why That Might Not Matter for SpaceX Investors.
While American consumers are becoming more cautious with spending, SpaceX investors should focus on different risks. The article argues that consumer weakness is not the primary concern for SpaceX since Starlink's demand is tied to connectivity needs rather than discretionary spending. Instead, investors should monitor SpaceX's premium valuation (110x trailing sales), declining Starlink pricing power (ARPU fell from $86 to $66), Starship execution risks, and heavy AI infrastructure spending. (The Motley Fool, Jul 2, 10:35 AM ET)
8. Is SpaceX Under $160 a Bargain or a Trap?
SpaceX stock has been volatile since its June IPO at $135 per share, currently trading around $157.54 with a $2.07 trillion market cap. While the company shows strong revenue growth (33% YoY to $18.7B) and promising AI contracts, the stock trades at 110x sales with a $4.9B net loss. The author views it as a trap rather than a bargain due to high valuation, expected larger losses ahead, and ~$800B in insider holdings becoming eligible for sale by October. (The Motley Fool, Jul 2, 9:15 AM ET)
Price Action
| Metric | Value |
|---|---|
| Open | $159.73 |
| High | $162.16 |
| Low | $155.88 |
| Close | $161.86 |
| Change vs prior close | +$4.32 (+2.74%) |
| Volume | 50,912,408 |
| Intraday range | $6.28 (155.88–162.16) |
| Close vs IPO | +19.90% above IPO offer price ($135.00); +0.57% above IPO-day close ($160.95) |
SPCX opened at $159.725, pushed as high as $162.16, dipped to a session low of $155.88, and closed at $161.86, up 2.74% from Wednesday's $157.54 close. Volume came in at 50,912,408 shares, well below both the prior session's 109,426,516 shares and the 177,947,850-share average volume to date, meaning the rally was accomplished on lighter-than-typical turnover. The close also sits fractionally above the June 12 IPO-day close of $160.95 and nearly 20% above the $135.00 IPO offer price. The stock recovered essentially all of Wednesday's decline on reduced participation, a rebound that has not yet been confirmed by a volume expansion.
Technicals
SPCX has traded for only 14 sessions since its June 12, 2026 IPO. Standard lookback indicators such as 14-day RSI and the 20-, 50-, and 200-day moving averages do not yet have enough history to compute and are not shown. The read below relies on price structure, candle shape, and the short-window averages the history can support (SMA-5, EMA-5, SMA-10).
Trend
The 5-day simple moving average sits at $161.54, the 5-day exponential average at $161.72, and the 10-day simple average at $161.09. Today's close of $161.86 sits above all three, a short-term bullish alignment, but each of these averages spans less than two weeks of trading and should be read as a proximity check on recent price, not a confirmed trend signal. Zooming out to the full close history, SPCX ran from its $160.95 IPO-day close up to a closing peak of $201.80 on June 16, then declined to a closing low of $153.00 on June 25, before stabilizing and climbing back into the $157–$171 area over the past week. Today's session extends that stabilization.
Candle read
Today's candle has a $2.14 body (open $159.73 to close $161.86, bullish), a small $0.30 upper wick, and a longer $3.84 lower wick, for a total range of $6.28. The close-location value of 0.95 means the close landed in the top 5% of the day's range. Together this describes a session that opened, sold off toward $155.88 intraday, then was bought back and pushed to a close near the day's high — a rejection of the lower part of the range rather than a rejection of the highs.
Support levels
- $157.54 — prior session's close
- $155.88 — today's intraday low
- $153.00–$154.60 — the closing-price shelf formed June 22–25
- $135.00 — the IPO offer price
Resistance levels
- $162.16 — today's intraday high
- $164.19 — June 29 close
- $170.86 — June 30 close, the most recent closing swing high
- $185.00–$201.80 — the post-IPO closing highs of June 16–18
Momentum interpretation
Bull scenario: a close back above the $164.19 level from June 29 would open a path toward the $170.86 swing high from June 30, ideally accompanied by volume closer to or above the 177.9-million-share average to confirm demand behind the move.
Bear scenario: a close back below today's $155.88 low and the $157.54 prior close would put the June 22–25 closing shelf around $153.00–$154.60 back in play as the next area to watch.
Neutral scenario: continued consolidation between roughly $157.54 and $162.16 while the market awaits a catalyst — index funds tracking the Nasdaq-100 must add SPCX ahead of its July 7 inclusion, and the company's first earnings report as a public company is still pending.
Trading Takeaway
SPCX reversed a large portion of Wednesday's decline on below-average volume, closing near its session high with a candle shape that shows lower-range buying rather than upper-range selling. The bounce keeps the stock within the $153–$171 band it has occupied since late June, still well below its June 16 closing peak of $201.80 but comfortably above its $135.00 IPO offer price. For the next session, the levels to watch are resistance at $162.16/$164.19 and support at $157.54/$155.88; a decisive move through either would clarify whether this bounce is the start of a retest of the June 29–30 highs or another failed rally within the post-IPO range.
Sources
- SpaceX, Amazon, and the Race to Own the Consumer's Digital Life. Which Stock Wins? — The Motley Fool
- Why AST SpaceMobile Stock Fell 21.6% In June — The Motley Fool
- SpaceX Stock: Buy, Sell, or Hold? — The Motley Fool
- A $200 Billion IPO Wave Could Wipe Out $1 Trillion in Stock Market Value. What Investors Need to Know. — The Motley Fool
- SpaceX Stock Edges Higher Before Joining Nasdaq-100 Index on July 7 — Benzinga
- EXCLUSIVE: Top 12 Most-Searched Tickers in June on Benzinga Pro — SpaceX, Marvell Join List, Micron Stays On Top — Benzinga
- Americans Are Cutting Back on Spending. Here's Why That Might Not Matter for SpaceX Investors. — The Motley Fool
- Is SpaceX Under $160 a Bargain or a Trap? — The Motley Fool
- Daiwa Capital Initiates Coverage On SpaceX with Neutral Rating, Announces Price Target of $175 — Benzinga
- Redwire up 10% This Week — Here's What's Driving the Space Stock Higher — Benzinga
- With the SpaceX IPO Reshaping the Nasdaq, Is QQQ Still a Smart Investment Right Now? — The Motley Fool
- NASA's Jared Isaacman Says Blue Origin's New Glenn Recovery Is 'Beyond Impressive' — Benzinga
- Trump Praises Micron's $250 Million Trump Accounts Commitment as CEO Highlights $200 Billion US Investment — Benzinga
- Will SpaceX Soar After It Joins the Nasdaq-100? History Offers a Compellingly Clear Answer. — The Motley Fool
- Elon Musk Calls Report on SpaceX AI Handheld Device 'Utterly False' After Claims of an iPhone Rival Sparks Online Buzz — Benzinga
- Taylor Swift Could Soon Be Writing a Bigger Check As Rhode Island's New Luxury Home Tax Officially Kicks In — Benzinga
- Dan Ives Leaves Wedbush After 8 Years, Teases New Investment Banking Venture — Benzinga
- FCC Moves to Speed Satellite License Reviews, Boosting SpaceX and Rival Broadband Networks — Benzinga
- Why SpaceX Stock Is Back Down to Around Its $150 Opening Price, and What to Expect Next — The Motley Fool
- Alpaca Markets (SIP) — market data
Disclaimer
This report is for informational purposes only and does not constitute investment advice, a recommendation, or an offer to buy or sell any security. Market data and news are sourced as cited above and may be delayed or incomplete. Readers should verify all figures independently and consult a licensed financial advisor before making investment decisions.