
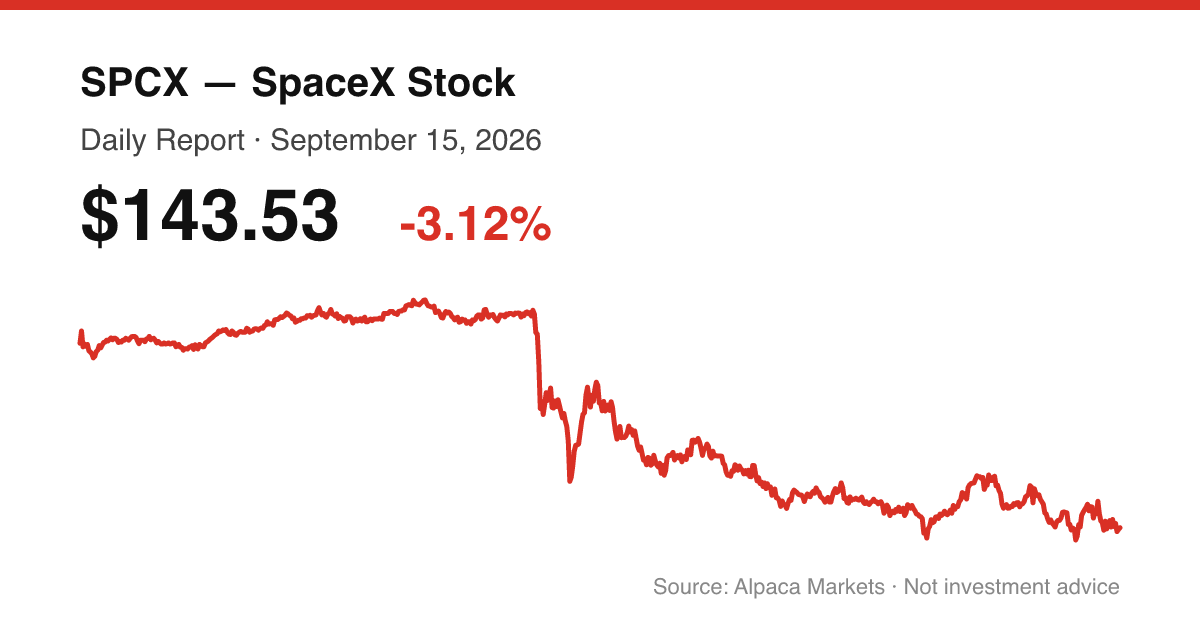
Hover to inspect · pre-market & after-hours shaded · MA(10) and RSI(14) computed from the session
SPCX · NASDAQ · September 15, 2026
Starship Books First Commercial Mission For 2028
SPCX closed at $143.53 on September 15, 2026, down 3.12% from the prior close of $148.15 on volume of 65,814,656 shares.
Executive Summary
SPCX gave back the prior session's ground on September 15, opening at $148.45, testing a high of $148.55 early, and selling off through the day to close at $143.53, a decline of 3.12%. Volume of 65.8 million shares came in below both the prior day's 67.9 million and the stock's running average of 76.0 million shares, so the drop happened on lighter-than-typical participation.
Coverage of the stock on the day centered on two threads. Motley Fool noted SPCX trading back near its opening-day levels roughly three months after the IPO, pointing to 92% year-over-year revenue growth and an AI-infrastructure segment now representing 33% of revenue, while also flagging a price-to-sales ratio near 70 and warning that AI-demand durability is uncertain. A separate Motley Fool piece cited a Morningstar sell rating on SPCX with a 58% downside target, arguing the stock is priced at roughly 94x sales while the company continues to burn cash. Benzinga also flagged a recurring overhang: insider share unlocks running through December 8, including a 1.3 billion-share release, even as Musk's own stake stays locked until 2027. Separately, former "Big Short" investors were reported warning that the SPCX and Anthropic IPOs could pressure broader equity markets. None of this coverage supplies a specific catalyst tied to today's session; it forms the backdrop against which the sell-off occurred.
News
1. Elon Musk Flags Taiwan as AI’s Weak Link. These Semiconductor ETFs Could Offer a Hedge
Elon Musk’s AI chip warning is putting Taiwan supply risks back in focus. Here are the ETFs offering alternative ways to play the buildout. (Benzinga, Sep 15, 4:17 PM ET)
2. Mark Cuban Asked Grok Whether AI Or Climate Change Will End Humanity. It Didn't Hesitate
Mark Cuban wants to know if AI or climate change is more likely to cause human extinction. Here's the answer he got. (Benzinga, Sep 15, 4:00 PM ET)
3. SpaceX Lines Up Starship's First Commercial Mission for 2028
SpaceX lines up Starship’s first commercial customer mission for 2028 as the rocket moves from internal flights toward paying customers. (Benzinga, Sep 15, 2:42 PM ET)
4. Elon Musk Calls AI Safety Warnings ‘4D Chess’—Then Proposes A Test That Could Expose Them
Elon Musk called AI safety warnings “4D chess” before proposing peer testing to expose unsafe models before release. (Benzinga, Sep 15, 1:09 PM ET)
5. Elon Musk Just Gave Nvidia’s Supply Chain A New Headache
Elon Musk warns Taiwan risks and limited chip capacity could create a new supply-chain headache for Nvidia as AI demand accelerates. (Benzinga, Sep 15, 12:42 PM ET)
6. Steve Eisman's 'Big Short' Partners Warn Anthropic, SpaceX IPOs Could Hurt Stocks
Steve Eisman’s former ‘Big Short’ colleagues warn SpaceX and Anthropic IPOs could pressure stocks as they bet heavily on gold. (Benzinga, Sep 15, 12:32 PM ET)
7. SpaceX Stock Faces a Risk That Keeps Coming Back in Waves
SpaceX faces insider share unlocks through Dec. 8, including a 1.3 billion-share release, while Musk’s stake remains locked until 2027. (Benzinga, Sep 15, 10:25 AM ET)
8. Elon Musk Warns Welfare State, Free Immigration Would 'Bankrupt' Countries: ‘AI + Robotics Is the Only Path to Universal High Income’
Elon Musk says AI and robotics can enable universal high income, warning welfare states and free immigration could bankrupt countries. (Benzinga, Sep 15, 9:09 AM ET)
Price Action
| Metric | Value |
|---|---|
| Open | $148.445 |
| High | $148.545 |
| Low | $142.872 |
| Close | $143.525 |
| Change vs prior close | -3.12% |
| Volume | 65,814,656 |
| Intraday range | $5.67 |
| Close vs IPO close ($160.95) | -10.83% |
SPCX opened at $148.445, essentially flat to the prior close of $148.15, ticked up to a high of $148.545 within the first stretch of the session, then reversed and sold off in a straight line to a low of $142.872 before closing at $143.525, just above the session low. The $5.67 intraday range was wide relative to recent sessions, and the close near the bottom of that range shows the selling pressure was sustained rather than a brief dip that got bought back. Against the June 12 IPO close of $160.95, SPCX is now down 10.83%; against the $135.00 IPO offer price, it remains up 6.31%.
The session was a clean reversal from an early attempt at a higher high into a close near the day's low on below-average volume.
Technicals
SPCX has been trading for roughly three months as of this report. The 14-day RSI and short moving averages below are computable, but the 200-day moving average is not yet available given the limited trading history, and even the shorter averages carry less statistical weight than they would on a mature, multi-year name. What follows leans on price structure, candle shape, volume, and the concrete levels in the data rather than on longer-horizon indicators the stock hasn't accumulated enough history to support.
Trend
Short-term averages are mixed relative to price. The close of $143.525 sits below the 5-day SMA ($147.72), the 5-day EMA ($147.01), and the 10-day SMA ($147.27), all of which the stock closed above as recently as last week. It sits just above the 20-day SMA ($143.27), effectively at that level, and remains well above the 50-day SMA ($134.46). The net picture is a stock that has pulled back to test its intermediate (20-day) trend support after a run that had carried it above its faster short-term averages, while the longer 50-day trend remains higher.
Candle read
The September 15 candle is a long bearish body: the $4.92 body accounts for the large majority of the $5.67 total range. The upper wick is minimal at $0.10, meaning the open sat almost exactly at the session high, so there was essentially no early strength to give back. The lower wick is $0.65, and the close location of 0.12 means the close finished only about 12% up from the session low. Sellers were in control from the open, with only a modest bounce off the day's low into the close.
Support levels
- $143.27 — the 20-day SMA, essentially coincident with today's close
- $142.87 — today's intraday low
- $140.00 — round-number level below the recent trading band
- $135.00 — the IPO offer price, sitting close to the $134.46 50-day SMA
Resistance levels
- $147.01 to $147.72 — the 5-day EMA/SMA cluster the stock closed below today
- $148.15 to $148.55 — today's open/high and the prior close, all bunched together
- $150.00 — round-number level above the recent range
- $151.21 — the September 11 close, the most recent higher close in the last week
Momentum interpretation
RSI-14 at 51.33 is roughly at the midpoint of its range, neither overbought nor oversold, which is consistent with a stock resetting rather than one that's been beaten down or overextended.
Bull scenario: a reclaim of the $147.01–$147.72 EMA/SMA cluster, followed by a close back above the $148.15–$148.55 prior close and today's high, would suggest today's decline was a one-day flush rather than a trend change, with $150.00 the next level to watch on continued strength.
Bear scenario: a close below the $142.87 intraday low and the $143.27 20-day SMA would put the $140.00 round number in play, with the $135.00 IPO offer price and the $134.46 50-day SMA as the next support cluster below that.
Neutral scenario: RSI near 51 and a close pinned right at the 20-day SMA leave room for the stock to chop within the $140–$148 band over the next few sessions without resolving in either direction.
Trading Takeaway
SPCX broke down through its short-term moving averages on September 15 on a long bearish candle closing near the session low, but did so on below-average volume, and RSI at 51.33 shows no sign of oversold exhaustion. The stock is now testing its 20-day SMA at $143.27 with the intraday low of $142.87 just beneath it. The next session's key levels to watch: support at $142.87 and then $140.00 on further weakness, resistance at the $147.01–$147.72 average cluster and then the $148.15–$148.55 prior-close/high zone on any recovery attempt.
Sources
- Elon Musk Flags Taiwan as AI's Weak Link. These Semiconductor ETFs Could Offer a Hedge — Benzinga
- Mark Cuban Asked Grok Whether AI Or Climate Change Will End Humanity. It Didn't Hesitate — Benzinga
- SpaceX Lines Up Starship's First Commercial Mission for 2028 — Benzinga
- Elon Musk Calls AI Safety Warnings '4D Chess'—Then Proposes A Test That Could Expose Them — Benzinga
- Elon Musk Just Gave Nvidia's Supply Chain A New Headache — Benzinga
- Steve Eisman's 'Big Short' Partners Warn Anthropic, SpaceX IPOs Could Hurt Stocks — Benzinga
- SpaceX Stock Faces a Risk That Keeps Coming Back in Waves — Benzinga
- Elon Musk Warns Welfare State, Free Immigration Would 'Bankrupt' Countries: 'AI + Robotics Is the Only Path to Universal High Income' — Benzinga
- Nvidia CEO Jensen Huang Says Elon Musk's Terafab May Look Audacious, But 'If Anybody Could Do It, He Can' — Benzinga
- Is SpaceX a Millionaire-Maker Stock? — The Motley Fool
- Elon Musk Says 'Excitement' is Guaranteed at Tesla Roadster Reveal in October: Audience Would Need to 'Vouch' That 'This Is Not AI' — Benzinga
- 2 Popular AI Stocks to Sell Before They Fall 53% and 58%, According to Wall Street Analysts — The Motley Fool
- SpaceX Is Trading Near Its Opening-Day Price Again. Forecasts Say a $5,000 Investment Will Be Worth This Much in 1 Year. — The Motley Fool
- Elon Musk Fuels Tesla-SpaceX Merger Talks Again, Says, 'Imagine What Action One Might Take…' — Benzinga
- Alpaca Markets (SIP) — market data
Disclaimer
This report is for informational purposes only and does not constitute investment advice. It is not a recommendation to buy, sell, or hold any security. Market data and figures are sourced as cited above and may be delayed or subject to revision. Verify all data independently before making any financial decision.