
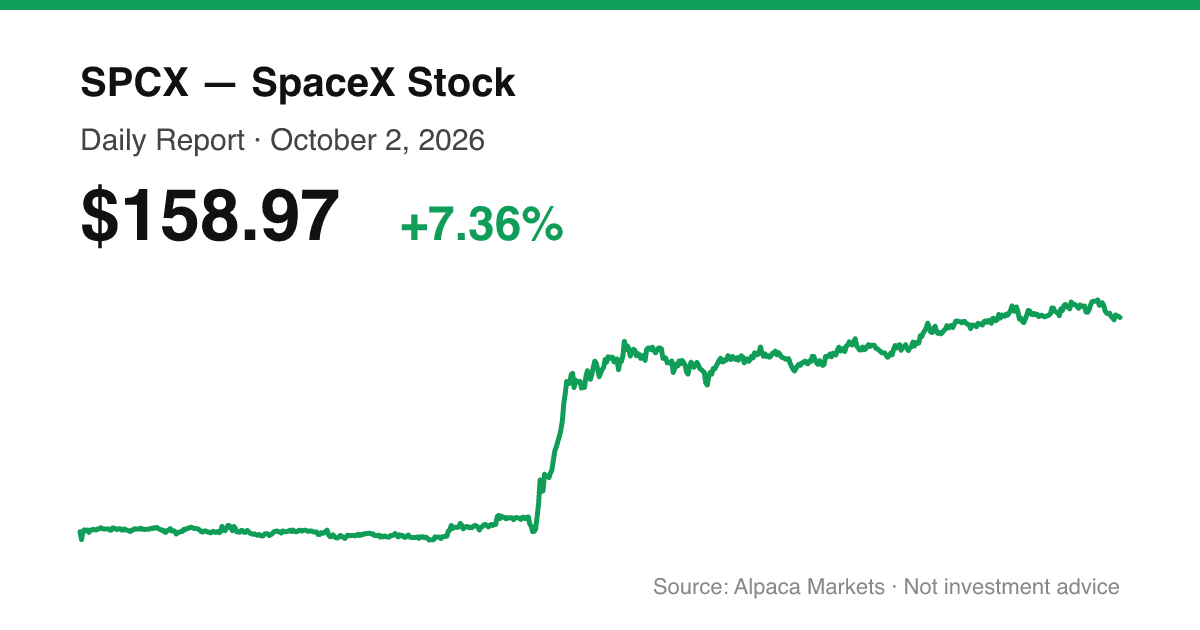
Hover to inspect · pre-market & after-hours shaded · MA(10) and RSI(14) computed from the session
SPCX · NASDAQ · October 2, 2026
SpaceX Surges After Three Launches in Under 13 Hours
SPCX closed Friday at $158.98, up $10.91 (7.36%) from the prior close of $148.07, on volume of 111,026,181 shares.
Executive Summary
SPCX had its strongest day in the recent record, rising 7.36% from $148.07 to $158.98. It opened at $149.54, near the prior close, and closed within about $0.87 of the session high of $159.84. The close is the highest since the July 6 close of $160.42. It is still $1.98 below the first-day close of $160.95 and far below the June 16 closing peak of $201.80.
The coverage attributes the move to SpaceX completing three launches in under 13 hours. According to The Motley Fool, these were a Crew Dragon mission, a Transporter satellite mission, and an NROL-97 National Reconnaissance Office mission. Benzinga reported the shares surging after multiple launches in the week's triple-launch effort. Benzinga also reported that a weak September payrolls print lifted the Nasdaq 100 to a record high, so the broader market backdrop was supportive. The Motley Fool articles put the intraday gain at roughly 6%. The 7.36% figure here is the full-session close against the prior close.
News
1. Why Is Planet Labs Stock Gaining Friday?
Planet Labs stock jumps after launching 20 satellites, including a prototype testing Google's AI chips in space. (Benzinga, Oct 2, 2:49 PM ET)
2. SpaceX Stock Surges: What's Going On?
Space Exploration Technologies shares are soaring Friday after completing multiple launches as part of this week's triple-launch effort. (Benzinga, Oct 2, 2:17 PM ET)
3. SpaceX Just Launched 3 Rockets in 13 Hours. Here’s What Investors Need to Know Right Now.
SpaceX launched three rockets in less than 13 hours, including NASA's Crew-13 mission to the ISS (fastest trip on record), a commercial payload flight with 130 satellites, and a classified Falcon Heavy mission. The stock rose 6% on the news. While the Space division reported a $542M operating loss, Starlink generated $4.3B in revenue with $1.7B operating profit. SpaceX's AI compute unit, though currently unprofitable at $1.3B loss, has major contracts potentially generating up to $3.4B monthly once operational. (The Motley Fool, Oct 2, 2:05 PM ET)
4. Planet Labs Stock Pops After 20 Satellite Launch
Planet Labs PBC shares are jumping Friday after the company announced the launch of 20 satellites aboard a SpaceX Falcon 9 rocket Thursday. (Benzinga, Oct 2, 12:57 PM ET)
5. Weak Jobs Report Lifts Nvidia, Nasdaq 100 to Record Highs: Stock Market Today
A weak September payrolls print pared bets on more Fed tightening, lifting both the Nasdaq 100 and Nvidia stock to record highs. (Benzinga, Oct 2, 12:52 PM ET)
6. Why Planet Labs Stock Popped on Friday
Planet Labs stock surged 7.8% after successfully launching 20 satellites via SpaceX's Falcon 9 rocket, including 18 SuperDove Earth observation satellites, one Tanager-2 hyperspectral satellite, and Project Suncatcher—an AI satellite developed with Google. While SuperDoves support current revenue, Project Suncatcher could open a significant new growth avenue by testing AI processing capabilities in orbit. (The Motley Fool, Oct 2, 12:06 PM ET)
7. 5.6 Million Downloads in Weeks: Meta Muse Outpaces Sorad ChatGPT in Early Rollout
Meta Muse crosses 5.6 million downloads, leveraging Instagram and WhatsApp distribution while Wall Street evaluates monetization. (Benzinga, Oct 2, 11:57 AM ET)
8. Why SpaceX Stock Popped on Friday
SpaceX stock surged 6.1% on Friday following three successful rocket launches completed in under 13 hours, including a Crew Dragon mission, a Transporter satellite mission, and an NROL-97 National Reconnaissance Office mission. Additionally, SpaceX's lucrative AI service contracts with Alphabet ($920 million/month) and Anthropic ($1.25 billion/month) are generating nearly $2.2 billion monthly in revenue, significantly outpacing traditional rocket launch income. (The Motley Fool, Oct 2, 11:31 AM ET)
Price Action
| Metric | Value |
|---|---|
| Open | $149.54 |
| High | $159.84 |
| Low | $149.34 |
| Close | $158.98 |
| Change vs prior close | +$10.91 (+7.36%) |
| Volume | 111,026,181 |
| Intraday range | $10.50 |
| Close vs IPO | +17.8% vs the $135.00 offer price; -$1.98 (-1.2%) vs the $160.95 first-day close |
The stock opened almost flat to the prior close and the low of $149.34 came close to the open, so buyers held control for most of the session. Price then climbed to a high of $159.84 and finished near that level. Volume of 111,026,181 compares with 69,158,126 on the prior session, about 1.6 times as much. It is also above the average to date of 93,791,824. A large gain on higher volume suggests broad participation rather than a thin move.
Over the last 30 sessions the stock has mostly traded between $140 and $155. Friday's close is above that band and above the September closing high of $154.81 on September 17.
Takeaway: SPCX gained 7.36% on heavy volume and closed near its high, breaking above its September range but still just under the IPO-day close.
Technicals
Technicals on a stock this young need caution. SPCX has about 75 sessions of history, and that history includes the post-IPO spike to $201.80 and the slide to $108.27 on August 5. The 200-day moving average is not available because there are not enough bars. The 50-day average and the 14-day RSI can be computed, but they are built from a short, volatile record, so read them as context. Price structure, candle shape, volume and real price levels carry more weight.
Trend
The short-term trend turned up on Friday. The 5-day SMA is $150.52, the 10-day is $150.43 and the 20-day is $150.13. All three are tightly clustered, which describes the sideways September range, and the close of $158.98 sits well above them. The 5-day EMA is $152.27. The 50-day SMA is $138.96, so price is about $20 above it. The 14-day RSI is 61.31, which is firm but not stretched. The broader picture is a recovery from the August 5 low of $108.27 into a range, and Friday is the first close clearly above that range.
Candle read
The candle is a strong bullish bar. The body is $9.44, which is about 90% of the $10.50 range. The upper wick is $0.87 and the lower wick is $0.20. The close sits at 0.92 of the day's range, meaning near the top. There was little selling into the high and almost no dip after the open. A candle like this shows steady buying through the session. A single strong day does not confirm a trend, and it needs follow-through in the next sessions.
Support levels
- $150.00 to $150.52: a round number that lines up with the 5-day, 10-day and 20-day SMAs ($150.52, $150.43, $150.13), and the open of $149.54 and low of $149.34 are just below. This is the first zone buyers need to hold.
- $148.07: the prior close and the base of Friday's gap-style move.
- $145.47: the September 28 close, the lowest close of the last week.
- $138.96: the 50-day SMA, with the $135.00 IPO offer price below it.
Resistance levels
- $159.84: Friday's intraday high.
- $160.00 to $160.95: the round number and the first-day close of $160.95. The July 6 close of $160.42 also sits here.
- $162.00: the July 2 close.
- $164.19 and $170.86: the June 29 and June 30 closes, the next reference points above the IPO-day close.
Momentum interpretation
Bull scenario: SPCX holds above $150 and pushes through $159.84 and the $160.95 first-day close. A close above that area would put the $162.00 and $164.19 closes in view. Volume staying above the $93,791,824 average would add weight to such a move.
Bear scenario: the gain fades and price falls back below $150, into the cluster of moving averages. A close below $148.07 would erase Friday's move entirely and put the stock back inside the September range, with $145.47 and the 50-day SMA at $138.96 as the next levels to watch.
Neutral scenario: price consolidates between $150 and $160 while the moving averages catch up. The stock would then be digesting a 7.36% move instead of extending or reversing it.
Trading Takeaway
SPCX broke out of a range of roughly $143 to $155 on its highest volume in the recent stretch of data. The reported driver is the three launches in under 13 hours, and the market backdrop was also supportive. The stock remains well below its June highs and slightly below the IPO-day close, so the move is a recovery inside a longer drawdown. Strong single-day moves on news often retrace part of the gain, so follow-through matters more than the day itself.
For the next session, the key levels are $159.84 and $160.95 on the upside, and $150.00 and $148.07 on the downside. Whether SPCX holds or loses the $150 zone is the clearest read on whether Friday's move has staying power.
Sources
- Why Is Planet Labs Stock Gaining Friday? (Benzinga)
- SpaceX Stock Surges: What's Going On? (Benzinga)
- SpaceX Just Launched 3 Rockets in 13 Hours. Here's What Investors Need to Know Right Now. (The Motley Fool)
- Planet Labs Stock Pops After 20 Satellite Launch (Benzinga)
- Weak Jobs Report Lifts Nvidia, Nasdaq 100 to Record Highs: Stock Market Today (Benzinga)
- Why Planet Labs Stock Popped on Friday (The Motley Fool)
- 5.6 Million Downloads in Weeks: Meta Muse Outpaces Sorad ChatGPT in Early Rollout (Benzinga)
- Why SpaceX Stock Popped on Friday (The Motley Fool)
- Here's How Fast SpaceX Must Grow to Be a $5 Trillion Company by 2030 (The Motley Fool)
- EXCLUSIVE: Top 12 Most-Searched Tickers in September on Benzinga Pro (Benzinga)
- VZ vs. SPCX: Which Stock Is the Better Value Option? (Zacks Investment Research)
- Trump Reportedly Asked Elon Musk's Grok What Would Happen if Nicolas Maduro Fell (Benzinga)
- Cathie Wood Praises Kalshi's 'Phenomenal' Leadership as ARK Bets on $5 Trillion Prediction Market Opportunity (Benzinga)
- Prediction: 2 Space Stocks That Could Join SpaceX and Rocket Lab in the Nasdaq-100 by 2030 (The Motley Fool)
- Elon Musk Says SpaceX's Starmind AI Satellites Could Pack in More Power Than ISS (Benzinga)
- Mark Zuckerberg Reportedly Helped Shape Trump's AI Rules, Ro Khanna Says 'Cannot Trust Tech Billionaires to Self-Police' (Benzinga)
- Alpaca Markets (SIP) — market data
Disclaimer
This report is for informational purposes only and is not investment advice, a recommendation, or an offer to buy or sell any security. Market data and news are drawn from the sources listed above and may contain errors or delays. Verify all figures independently before making any financial decision.